dip5_hold5 — AAPL
AAPL · USD · starting equity 10,000 USD
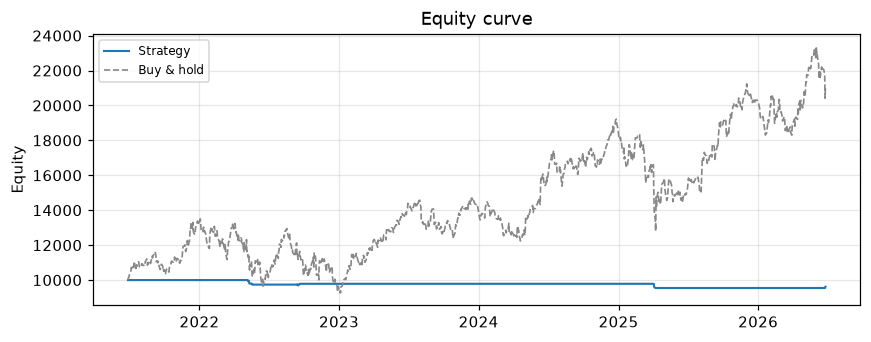
Summary — strategy vs buy & hold
| Metric | Strategy | Buy & hold |
|---|---|---|
| Total return | -3.85% | 110.55% |
| CAGR | -0.78% | 16.08% |
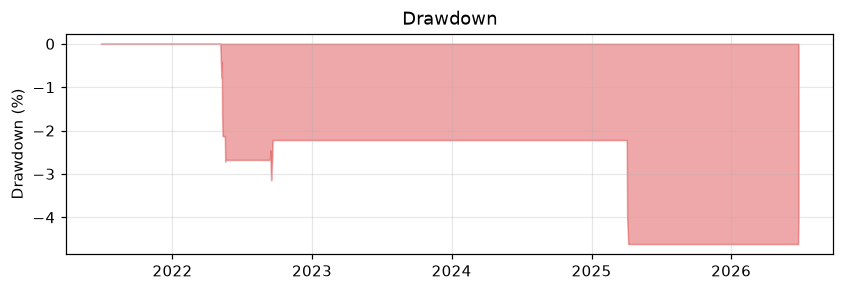
| Max drawdown | -4.62% | -33.43% |
| Sharpe | -0.62 | 0.68 |
| Win rate | 16.67% | — |
| # trades | 6 | — |
| Exposure | 1.20% | 100.00% |
Strategy (DSL)
id: dip5_hold5
name: "Dip 5% buy, 5-bar hold"
timeframe: 1d
# no indicators needed; uses the built-in daily_return field
entry: {when: "daily_return <= -0.05"}
exit:  {after_bars: 5}
risk:  {stop_loss_pct: 5}
sizing: {mode: fixed_fraction, fraction: 0.25, max_concurrent: 4}
Equity & drawdown
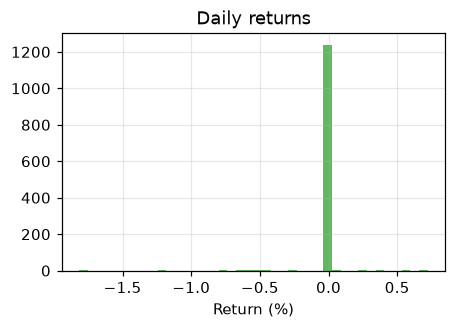
Daily returns
Price & trades
Trades
| Entry | Exit | Qty | Entry px | Exit px | PnL | Return |
|---|---|---|---|---|---|---|
| 2022-05-05 | 2022-05-11 | 15 | 156.77 | 146.50 | -154.05 USD | -6.55% |
| 2022-05-11 | 2022-05-12 | 13 | 146.50 | 142.56 | -51.22 USD | -2.69% |
| 2022-05-18 | 2022-05-20 | 17 | 140.82 | 137.59 | -54.91 USD | -2.29% |
| 2022-09-13 | 2022-09-20 | 15 | 153.84 | 156.90 | 45.90 USD | 1.99% |
| 2025-04-03 | 2025-04-04 | 12 | 203.19 | 188.38 | -177.72 USD | -7.29% |
| 2025-04-04 | 2025-04-07 | 9 | 188.38 | 181.46 | -62.28 USD | -3.67% |