dip5_hold5 — BBCA
BBCA · IDR · starting equity 100,000,000 IDR
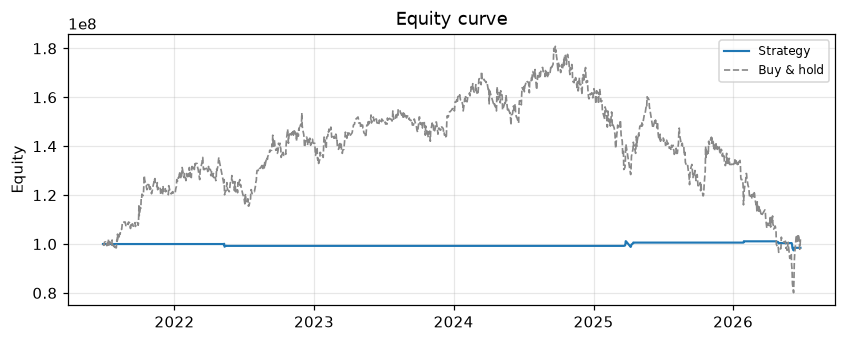
Summary — strategy vs buy & hold
| Metric | Strategy | Buy & hold |
|---|---|---|
| Total return | -1.55% | 1.98% |
| CAGR | -0.31% | 0.39% |
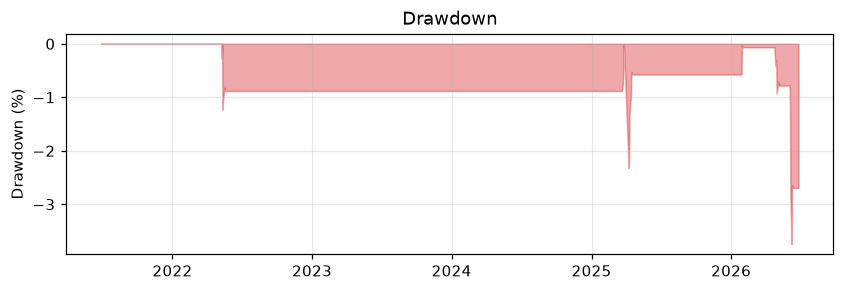
| Max drawdown | -3.74% | -55.71% |
| Sharpe | -0.17 | 0.14 |
| Win rate | 42.86% | — |
| # trades | 7 | — |
| Exposure | 2.09% | 100.00% |
Strategy (DSL)
id: dip5_hold5
name: "Dip 5% buy, 5-bar hold"
timeframe: 1d
# no indicators needed; uses the built-in daily_return field
entry: {when: "daily_return <= -0.05"}
exit:  {after_bars: 5}
risk:  {stop_loss_pct: 5}
sizing: {mode: fixed_fraction, fraction: 0.25, max_concurrent: 4}
Equity & drawdown
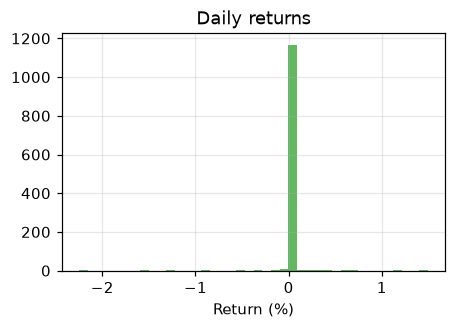
Daily returns
Price & trades
Trades
| Entry | Exit | Qty | Entry px | Exit px | PnL | Return |
|---|---|---|---|---|---|---|
| 2022-05-09 | 2022-05-17 | 3284 | 7600.00 | 7400.00 | -754,992.00 IDR | -2.63% |
| 2025-03-21 | 2025-04-08 | 3135 | 7900.00 | 7775.00 | -489,962.00 IDR | -1.58% |
| 2025-04-08 | 2025-04-15 | 2390 | 7775.00 | 8575.00 | 1,832,891.00 IDR | 10.29% |
| 2026-01-28 | 2026-01-29 | 3574 | 7025.00 | 7200.00 | 523,457.00 IDR | 2.49% |
| 2026-04-24 | 2026-05-04 | 4171 | 6050.00 | 5900.00 | -725,024.00 IDR | -2.48% |
| 2026-06-03 | 2026-06-05 | 4535 | 5525.00 | 5075.00 | -2,135,872.00 IDR | -8.14% |
| 2026-06-05 | 2026-06-09 | 3703 | 5075.00 | 5150.00 | 201,860.00 IDR | 1.48% |