ema_crossover — AAPL
AAPL · USD · starting equity 10,000 USD
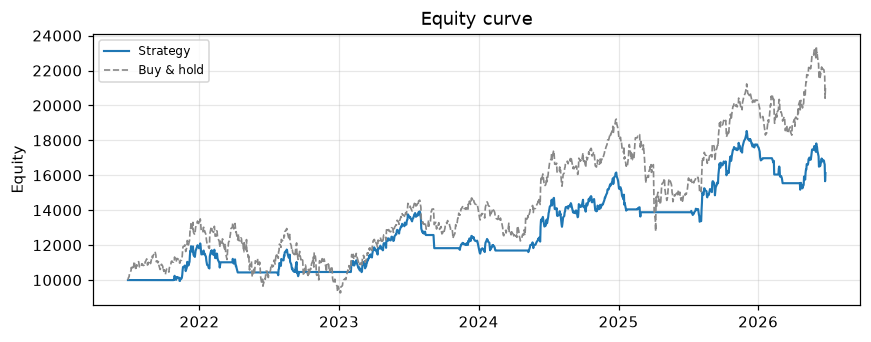
Summary — strategy vs buy & hold
| Metric | Strategy | Buy & hold |
|---|---|---|
| Total return | 61.26% | 110.55% |
| CAGR | 10.04% | 16.08% |
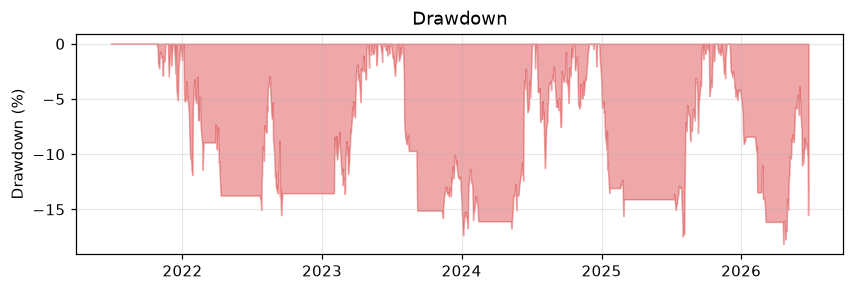
| Max drawdown | -18.13% | -33.43% |
| Sharpe | 0.65 | 0.68 |
| Win rate | 45.45% | — |
| # trades | 11 | — |
| Exposure | 56.49% | 100.00% |
Strategy (DSL)
id: ema_crossover
name: "EMA20 / EMA50 crossover"
timeframe: 1d
indicators:
  - {name: ema20, type: EMA, period: 20, source: close}
  - {name: ema50, type: EMA, period: 50, source: close}
entry: {when: "cross_above(ema20, ema50)"}
exit:  {when: "cross_below(ema20, ema50)"}
risk:  {stop_loss_pct: 5}
sizing: {mode: all_in, max_concurrent: 1}
Equity & drawdown
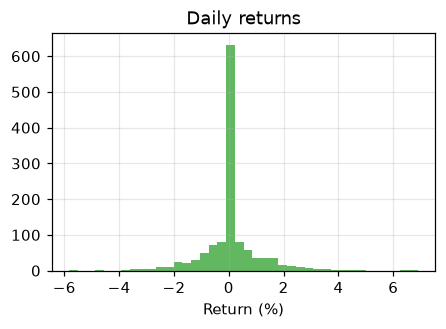
Daily returns
Price & trades
Trades
| Entry | Exit | Qty | Entry px | Exit px | PnL | Return |
|---|---|---|---|---|---|---|
| 2021-10-22 | 2022-02-25 | 63 | 148.69 | 164.85 | 1,018.08 USD | 10.87% |
| 2022-03-28 | 2022-04-11 | 59 | 175.60 | 165.75 | -581.15 USD | -5.61% |
| 2022-07-22 | 2022-09-19 | 64 | 154.09 | 154.48 | 24.96 USD | 0.25% |
| 2023-02-01 | 2023-08-16 | 68 | 145.43 | 176.57 | 2,117.52 USD | 21.41% |
| 2023-09-05 | 2023-09-07 | 62 | 189.70 | 177.56 | -752.68 USD | -6.40% |
| 2023-11-10 | 2024-02-14 | 60 | 186.40 | 184.15 | -135.00 USD | -1.21% |
| 2024-05-09 | 2025-01-22 | 60 | 184.57 | 223.83 | 2,355.60 USD | 21.27% |
| 2025-02-19 | 2025-02-28 | 54 | 244.87 | 241.84 | -163.62 USD | -1.24% |
| 2025-07-09 | 2026-01-13 | 62 | 211.14 | 261.05 | 3,094.42 USD | 23.64% |
| 2026-02-06 | 2026-02-12 | 57 | 278.12 | 261.73 | -934.23 USD | -5.89% |
| 2026-02-23 | 2026-03-06 | 57 | 266.18 | 257.46 | -497.04 USD | -3.28% |